Justification is good; transparency is better
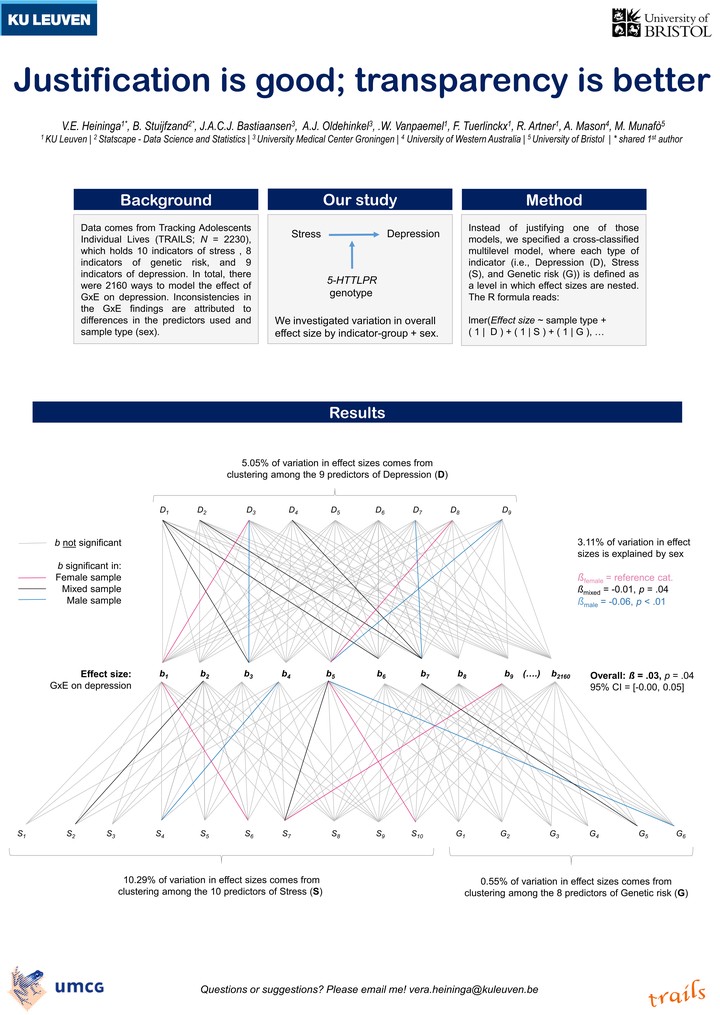
Data comes from Tracking Adolescents Individual Lives (TRAILS; N = 2230), which holds 10 indicators of stress , 8 indicators of genetic risk, and 9 indicators of depression. In total, there were 2160 ways to model the effect of GxE on depression. Inconsistencies in the GxE findings are attributed to differences in the predictors used and sample type (sex).
Instead of justifying one of those models, we specified a cross-classified multilevel model, where each type of indicator (i.e., Depression (D), Stress (S), and Genetic risk (G)) is defined as a level in which effect sizes are nested. The R formula reads:
$$lmer(Effect size ~ sample type + ( 1 | D ) + ( 1 | S ) + ( 1 | G ), … $$